|
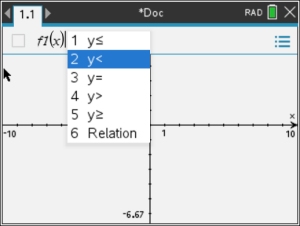
When the screen is waiting for you to enter "f 1(x) =", hit  to delete the "=" sign. to delete the "=" sign.
A drop down box of alternative inequality choices will appear (Box 1).
Choose the needed inequality symbol.
For this example, choose "2 y< ".
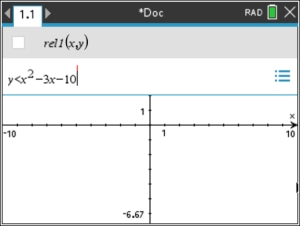
When you make your choice, Box 2 will appear showing that your entry is being classified as a relation, "rel 1(x,y)".
Enter the quadratic expression. Hit 
For this example, enter x2 - 3x - 10.
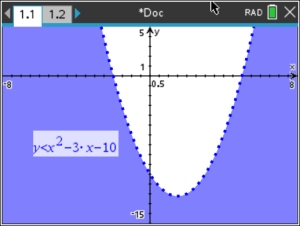
The graph will appear with the shading either around the outside of the parabola, or in the interior of the parabola. (Box 3 - purple)
For this example, the shading is around the outside.
Since this inequality was strictly "less than", the parabola itself is not part of the purple solution, so it appears as a dotted line in a slightly darker shade of the coloring.
If it was to be part of the solution (for example for <), the parabola would have been graphed as a darker solid line.

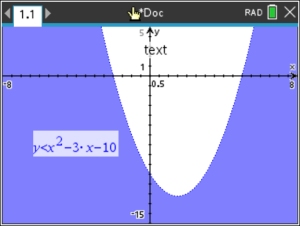
Note: If you are not seeing the dotted line for the parabola, it may be that your thickness level of the parabola is set at "thin" and it is blending in with the shading. You can either change the color of the parabola, or change the thickness of the parabola.
How to control the display of the graph:
To change line thickness of parabola:
•  #1 Action, #4 Attributes #1 Action, #4 Attributes
• scroll onto the parabola, to activate the parabola.
Press
(a vertical listing of three small boxes will appear).
Box 4.
•
The first of the boxes controls line thickness.
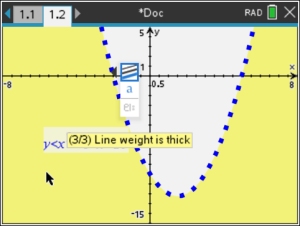
From the first box, arrow right or left to control the thickness: "thin", "medium", "thick".
Box 3 shows "medium".
Box 3a shows "thin" (that disappears)
Box 4 shows "thick".
• After your choice, hit .
To change color (line and shade fill):
• #1 Action, #5 Set Conditions
• scroll onto the parabola, to activate the parabola.
Press
• drop-down box "Conditional Attributes" appears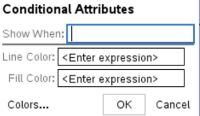
• click on the word "Colors" at the bottom of the box
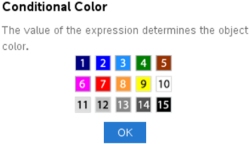
Choose the color number. Type the number under
"Line Color:" for the parabola
"Fill Color:" for the shading
OK
• After your choice, hit .
|
Add a Grid: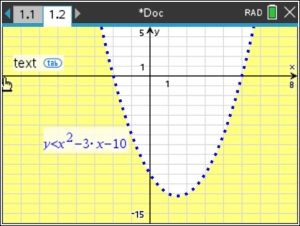
If you want to add a "grid" to get a better look at the zeros,
• #2 View, #6 Grid
#3 Lined Grid |