|
A line
of best fit (or "trend"
line) is a straight line
that best represents the data on a scatter plot.
This line may
pass through some of the points, none of the points, or all of the points. |
|
You can examine
lines of best fit with:
1. paper and pencil only,
2. a combination of graphing calculator and
paper and pencil,
3. or solely with the graphing calculator.
|
Example: Is there
a relationship between the fat grams and the total calories
in fast food?
| Sandwich |
Total Fat (g) |
Total Calories |
| Hamburger |
9 |
260 |
| Cheeseburger |
13 |
320 |
| Quarter Pounder |
21 |
420 |
| Quarter Pounder with Cheese |
30 |
530 |
| Big Mac |
31 |
560 |
| Arch Sandwich Special |
31 |
550 |
| Arch Special with Bacon |
34 |
590 |
| Crispy Chicken |
25 |
500 |
| Fish Fillet |
28 |
560 |
| Grilled Chicken |
20 |
440 |
| Grilled Chicken Light |
5 |
300 |
|
Paper and Pencil Solution:
Can we predict the number of total calories based upon the total fat grams? |
|
1. Prepare a scatter plot of
the data on graph paper.
2. Using a strand of
spaghetti, position the spaghetti so that the plotted points are as close
to the strand as possible.
3. Find two points that you think will be
on the "best-fit" line.
4. We are choosing the points (9, 260) and
(30, 530).
You may choose different points.
5. Calculate the slope of the
line through your two points (rounded to
three decimal places).
6. Write the equation of the
line.
7. This equation can now be used to predict information
that was not plotted in the scatter plot.
Question: Predict the total calories based upon 22 grams of fat.
ANS: 427.141 calories
|
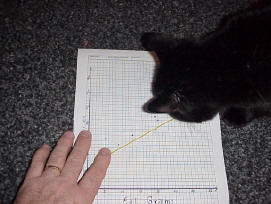
Our assistant, Bibs, helps position
the strand of spaghetti.
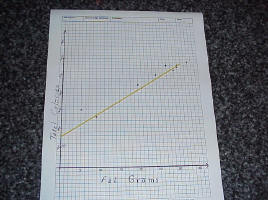
Choose two points that you think will
form the line of best fit.
Predicting:
- If you are looking for values that fall within the plotted values, you are interpolating.
- If you are looking for values that fall outside the plotted values, you are extrapolating.
Be careful when extrapolating. The further away from the plotted values you go, the less reliable is your prediction. |
|
In step 4 above, we chose two points to form our line-of-best-fit. It is possible, however, that someone else will choose a different set of points, and their equation will be slightly different.
Your answer will be considered CORRECT, as long as your calculations are correct for the two points that you chose. So, if each answer may be slightly different, which answer is the REAL "line-of-best-fit?
So who has the REAL "line-of-best-fit"? |
To answer this question, we need the assistance of a graphing calculator. We saw that different people may choose different points and
arrive at slightly different equations for their lines of best fit. All of them are "correct",
but which one is actually the "best"? Simply stated, the graphing calculator has the capability of determining which line will "actually" represent the REAL line-of-best-fit.
|
Graphing Calculator Solution:
Can we predict the number of total calories based upon the total fat grams? |
1. Enter the data in the calculator
lists. Place the data in L1 and L2.
STAT, #1Edit,
type values into the lists |
|
2. Prepare a scatter plot of the data.
Set up for the scatterplot.
2nd StatPlot - choices shown at right.
Choose ZOOM #9 ZoomStat. Graph shown below.
|
 |
3. Have the calculator determine the line of
best fit.
STAT → CALC #4 LinReg(ax+b)
Include the
parameters L1,
L2, Y1.
(Y1 comes from VARS → YVARS, #Function, Y1)
You now have the values of
a and b needed to
write the equation of the line of best fit. See values at
the right.
y = 11.73128088x + 193.8521475
|
 |
| 4. Graph
the line of best fit. Simply hit GRAPH.
To get a predicted value within the
window, hit
TRACE,
up arrow, and type the desired value.
The
screen above shows x = 22.
|
Question: Predict the total calories based upon 22 grams of fat.
ANS: 451.940 calories
Compare this answer with the answer we got by hand. |
|