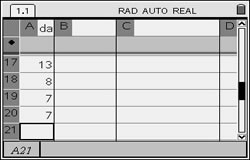
Nspire Stat Logo Main Page MathBits.com Table of Contents MathBits.com Terms of Use TI-84+ Web Site

Histogram

Given the data set
{13, 3, 10, 9, 7, 10, 12, 8, 6, 3, 9, 6, 11, 5, 9, 10 13, 8, 7, 7},
create a histogram representing this data.

1.  Enter the data into the Lists & Spreadsheets area.
  (See Lists and Spreadsheets for entering data.)

animated histogram

histogram list

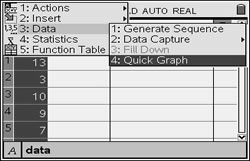
2.  Arrow up to select the entire column.
Press menu and choose #3 Data, #4 Quick Graph.

histogram2

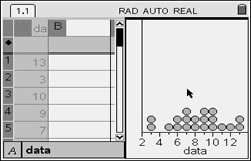
3.  The window will be split and a dot plot will appear to the right.

Remember that CTRL-TAB will move between the split screens.

histogram 4

4. From the right window, press MENU.

Choose #1 Plot Type, #3 Histogram

histogram 5
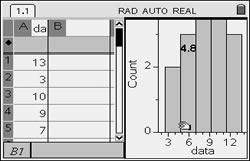
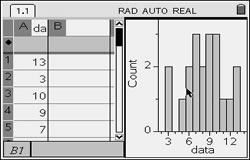
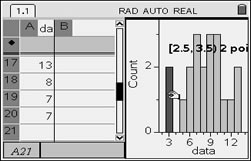
5. To see the size of the bars and the number of values represented by each bar, click on the bar.
histogram 8

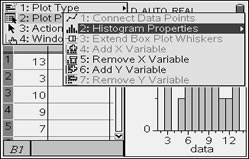
6. To adjust the histogram, press MENU.

Choose #2 Plot Properties, #2 Histogram Properties

#1 Histogram Scale
#1 Count = Displays the data based upon the number of values that occur within each bar (or bin) on the histogram. This is the default data representation when you create a histogram. The Count tool is not available because it is currently in use.
#2 Percent = Displays data in the histogram by each group’s percent value of the whole data set.
#3 Density = Displays data in the histogram based upon the density of each value within the data set.
#2 Bin Settings - Displays a dialog for setting the
histogram values for bin (bar) width and alignment.
You can adjust the bins’ width and number by dragging the side of one bin. A value that occurs on the edge of a bin is counted in the bin to the right. Avoid problems by staying with the default bin widths.


histogram6

The number of bins displayed depends upon the number of data points
and the distribution of these points.


histogram 7
Each bin (bar) width can be adjusted by
clicking and dragging the side of the bin.


Table of Contents | MathBits.com | Terms of Use