|

Conics: Graphing Circles
Solution:
- Enter the equation into Y= by
solving for y.

- Enter the positive square root into Y1.
- Enter the negative square root into Y2,
or enter the negation of Y1.
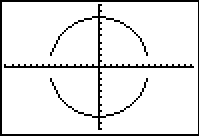
- If you choose ZOOM #6 (the standard
window), the graph will appear to be an ellipse rather than a circle
due to the 3/2 aspect ratio of the viewing screen (the standard
viewing screen is not a square).
- Choose ZOOM#5 ZSquare to create a
viewing window where the units on both axes are the same length.
|
|
NOTE:
* You may notice that
the "vertical" edges of the graph may not appear in the
viewing window. The viewing screen cannot graph points
that fall between pixels.
* You may notice that
the TRACE function will not move automatically between the
two sections of the graph because the positive and negative
square roots were graphed as two separate equations.
The up arrow can be used to move between the two sections of
the graph. Also, the cursor will disappear if it is
moved beyond the domain for which x is defined. |
Example B: Graph: 
Solution:
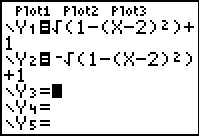
- Enter the equation into Y= by
solving for y.

- Enter the equation with the positive square root into Y1.
- Enter the equation with the negative square root into Y2. You cannot simply negate Y1 to obtain
Y2 in this problem.
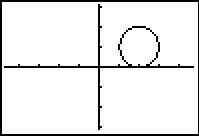
- Choose ZOOM#5 ZSquare to create a
viewing window where the units on both axes are the same length.
|
|
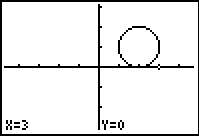
Solution Using DRAW:
(please
follow steps in order)
- Press ZOOM#4 (ZDecimal) to
go to a graphing screen.
- To graph the circle, press 2nd
PRGM (DRAW) #9 Circle.
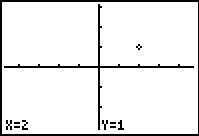
- Move the cursor to the "h" value of +2 by using
the arrows.
- Move the cursor to the "k" value of +1 by using
the arrows.
- Press ENTER to set the
point for the center of the circle.
- Move the cursor the length of the radius (1) away from
the center. Keep track of the values at the bottom of
the window.
- When you hit ENTER, the
circle will be automatically drawn.
- You may need a larger window if your radius is large. (Zoom
Out)
|
|
Tidbit:
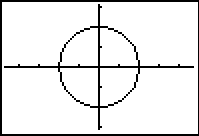
You can use a "list" approach
to deal with the plus and minus square roots:
Graph:  which becomes
Enter: 
Tracing still requires arrowing up and down between
entries. |
|
|

Finding
Your Way Around TABLE of CONTENTS
|