Histograms
Histograms
Given the data set
{13, 3, 10, 9, 7, 10, 12, 8, 6, 3, 9, 6, 11, 5, 9, 10 13, 8, 7, 7},
create a histogram representing this data.
| 1. CLEAR
out the graphs under
y = (or turn them off). 2. Enter the data into the calculator lists. Choose STAT, #1 EDIT and type in entries. (See Basic Commands for entering data.) |
|
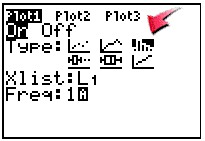
3. To plot a histogram: Press 2nd STATPLOT and choose #1 PLOT 1. You should see the screen at the right. Be sure the plot is ON, the histogram icon is highlighted, and that the list you will be using is indicated next to List. Freq: 1 means that each piece of data will be counted one time. |
|
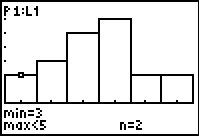
4. Controlling the graphical display of a histogram: To see the histogram, press ZOOM and #9 ZoomStat. (ZoomStat automatically sets the window to an appropriate size to view all of the data.) Press the TRACE key to see on-screen data about the histogram. The spider will jump from bar to bar showing the range of values contained within each bar and the number of entries from the list (n) that fall within that range. |
|
|
|
|
![]()
Finding Your Way Around
TABLE of CONTENTS